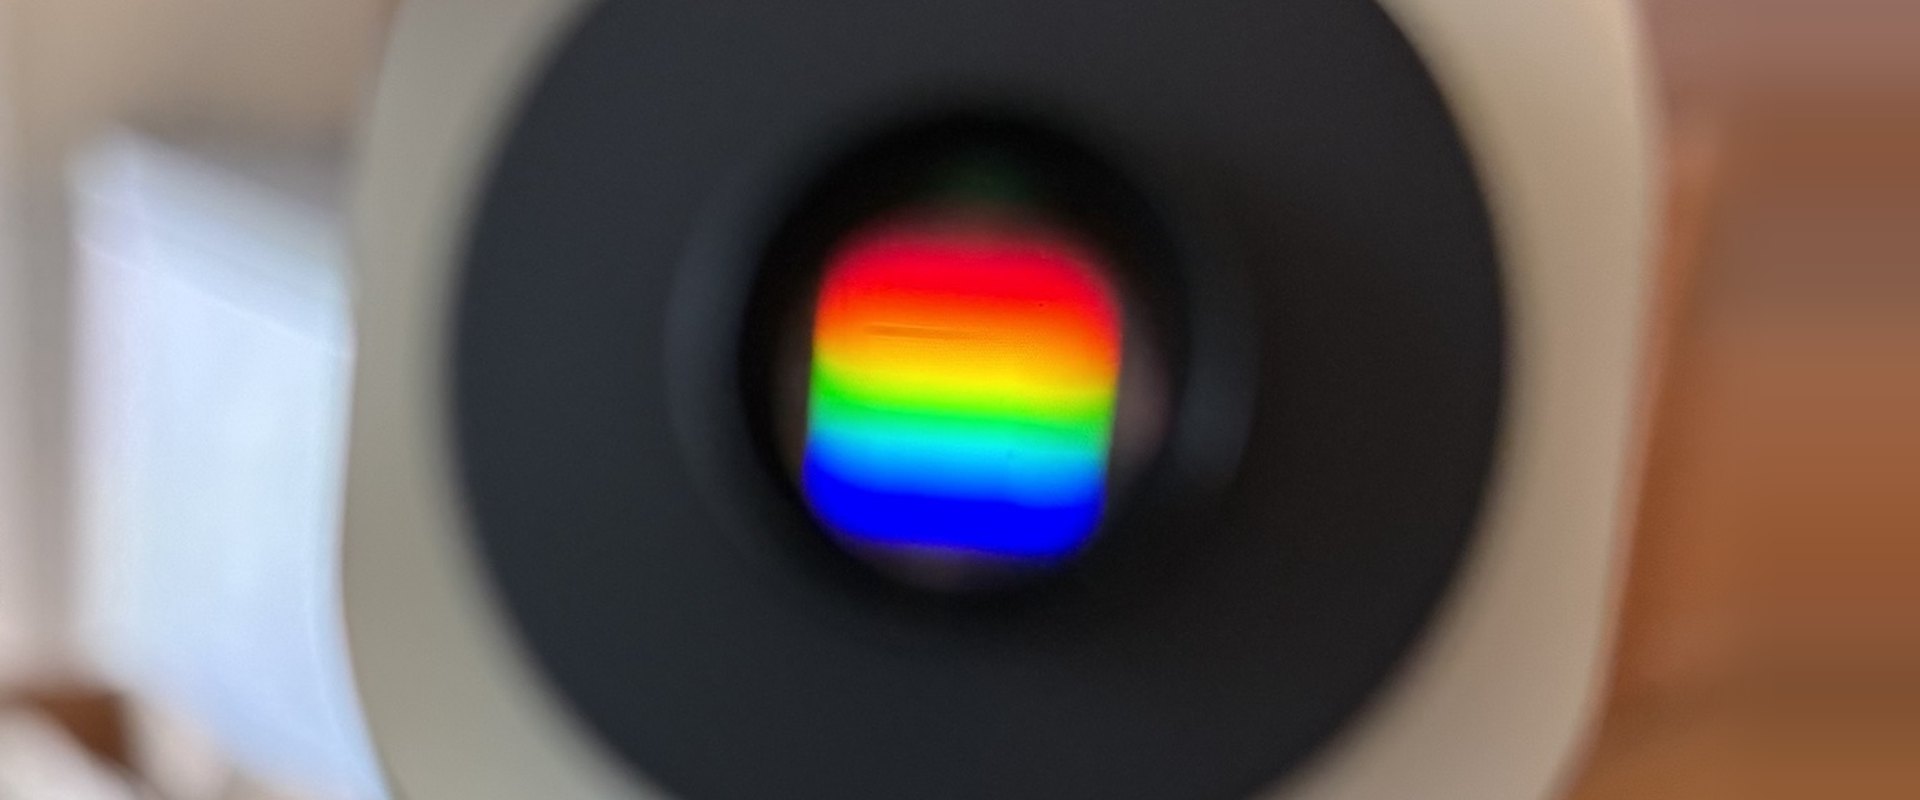
First light: the spectrum through the eyepiece.
Hyperspectra
A portable line-scanning hyperspectral camera I built to see past human vision, from visible light into the near infrared.
- Context
- Personal project, 2025–present
- Role
- Optics, hardware prototyping, calibration
- Hardware
- OpenHSI optical design, a XIMEA camera with a Sony sensor, an NVIDIA Jetson on battery, and 3D-printed mounts. About $3,500.
- Tools
- Capture and processing software built with AI coding agents. AI is my general assistant for research and prototyping; I direct the work and test the result.
- Code
- github.com/christophernagel/hyperspectra
Why
It's for my own learning. I wanted to understand hyperspectral imaging and remote sensing from the inside: what's in the light around us that our eyes never register, and how you capture it.
It's one of three linked projects. The camera is about the physics of capture, the analysis software is about understanding the data, and the Spectral Light Lab is about how I want people to experience it.
The build
The optical design follows OpenHSI, an open-source hyperspectral camera. Light passes through a slit 25 microns wide, a collimating lens and a diffraction grating, then lands on a XIMEA camera with a Sony sensor. Each frame records one line of the scene, spread into its wavelengths. A motorized gantry will sweep that line across a scene to build a full image.
A Jetson computer runs capture from a battery pack, so it works in the field. It cost about $3,500, most of it the XIMEA camera. I did the optics, 3D-printed mounts, assembly and troubleshooting by hand, and went through several versions of the mounts and the battery clip. I directed AI for the capture and processing software.


Trusting the measurement
Getting a spectrum to appear was easy. Knowing which parts of it to believe took a series of fixes, each removing one reason for doubt.
- Slit alignment. The lens holder didn't seat the thin aluminum slit securely, and a small O-ring either blocked the barrel or sat loose. An O-ring sized like the holder, slightly larger to press-fit, held it.
- Exposure. Long exposures clipped the brightest lines, and short ones were too weak. I settled on about 5 ms: bright, with no clipped pixels.
- A misleading preview. The contrast-stretched preview looked fine while the raw numbers underneath were clipped, so I judged only from the raw data.
- A light source that hid the range. The white LED's bright patch didn't show the camera's full coverage, and cropping to it threw away calibration lines.
- Direction and line centers. I confirmed that wavelength increases left to right, and placed each line center between pixels.
- A clipped reference. One processed spectrum looked plausible, but the white reference it was divided by had saturated. A matched 7 ms session fixed it.


Calibration
I calibrated against a mercury-argon lamp, whose emission lines sit at known wavelengths. I matched 17 lines and fit a curve from sensor column to wavelength. It lands within about 0.56 nm of the known lines on average, and a second exposure gave 0.561 nm.


Field test
In a parking lot, I pointed the camera at black, white, red and leaf targets. These are very different materials with well-known spectral signatures, so I could compare the camera's response with catalogued spectra. The leaf shows the red edge, the sharp rise near 700 nm that marks healthy vegetation.


The white target became a second check on the calibration. Its curve dips at the Fraunhofer lines, dark lines in sunlight at known wavelengths: hydrogen near 486 and 656 nm, magnesium near 517, sodium near 589, and two oxygen bands from Earth's atmosphere near 687 and 760 nm. Each dip lands 1.5 to 3 nm short of its known wavelength, a consistent shift larger than the lamp calibration's 0.56 nm. The 760 nm dip shows in the white, red and leaf curves alike, because it's in the sunlight itself.

Next
- Account for the shift. Work out why the sunlight lines land a few nanometers short of the lamp calibration.
- Calibrate to reflectance. Refine the calibration against a PTFE block, a near-perfect white reflector, so readings convert to true reflectance.
- Finish the gantry. Complete the motorized gantry, so the camera can scan full scenes.
- Close the loop. Load my own captures into the Spectral Light Lab.