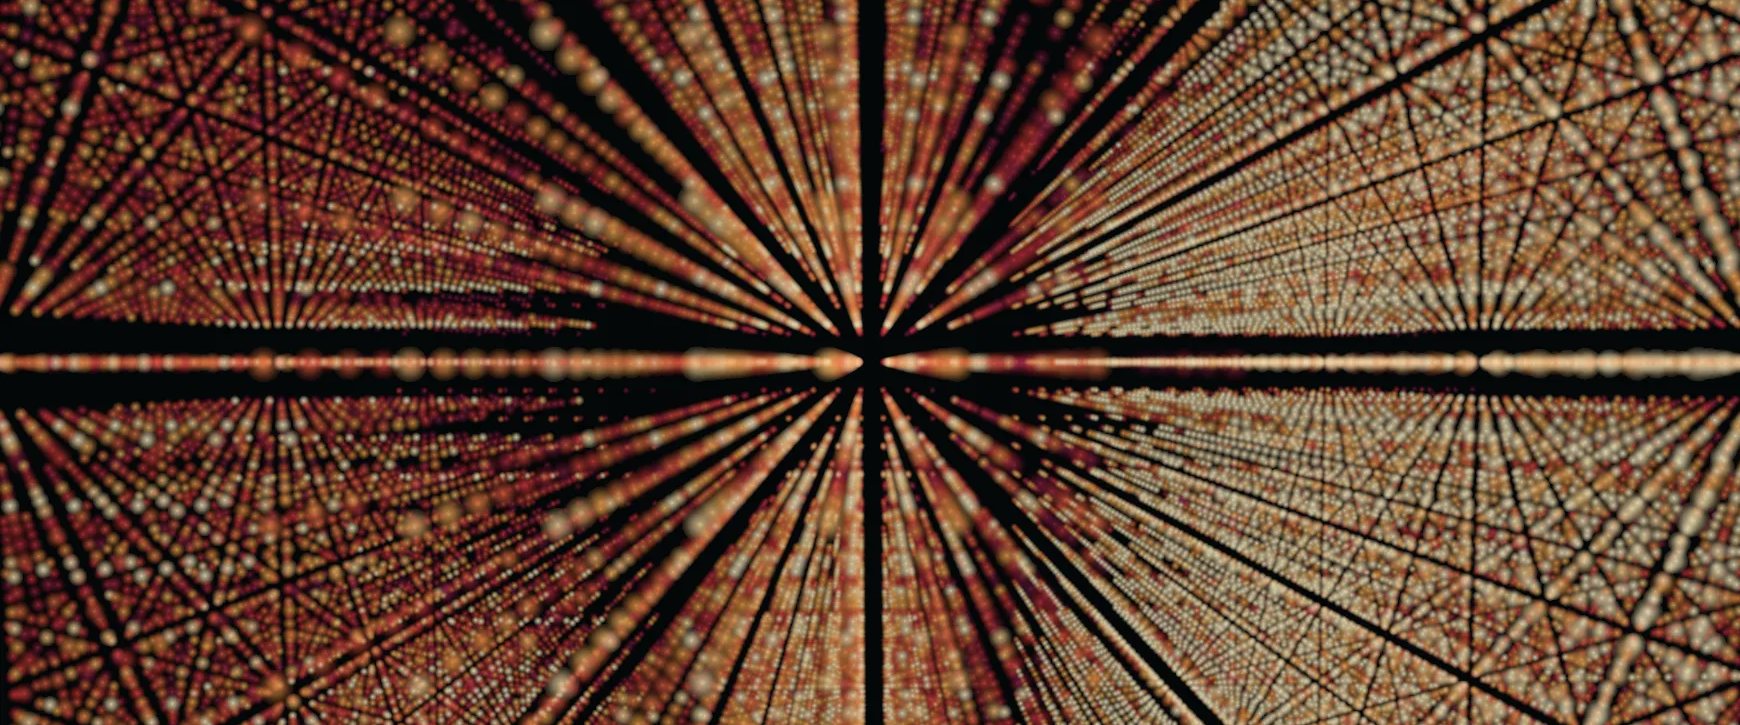
Each point of the image becomes a column of light. Image: christophernagel.com/spectral
Spectral Light Lab
What do you see? A 3D viewer for the light our eyes filter out.
- Context
- Personal project, 2026
- Role
- Concept, interaction design, data visualization, build
- Data
- Prototyped with NASA AVIRIS airborne scenes of the Santa Barbara coast and the Sacramento Delta; built to read captures from my own camera, Hyperspectra
- Tools
- Three.js (WebGL) in the browser, built with AI coding agents. AI is my general assistant for research and prototyping; I direct the work and test the result.
- Try it
- christophernagel.com/spectral
Idea
Everything we see is our brain processing a narrow slice of the light around us. The rest is there all the time, and we filter it out. Our reasoning, and the claims we make about the world, inherit those limits. I wanted people to experience that hidden information as light in space and ask themselves: what do you see, and what are you missing?
It's also a question I bring to AI. When we train and evaluate a language model as an arbiter of truth, do we mean truth itself, or truth as our senses have let us define it?
Question
The viewer is the prototype for a physical display made of points of light. A display like that has far fewer lights than a camera has pixels, and less precision across wavelengths. So the first question was practical: would an image still be recognizable as a volume of lights, or would it read as a hazy blob?
I'm prototyping with scenes from NASA's AVIRIS airborne spectrometer, a crop of the Santa Barbara coast and a capture of the Sacramento Delta, and built the viewer to read captures from my own hyperspectral camera as well.
Design

- Volume as the native format. Each point in the image becomes a column of light, one layer per wavelength band: the expanded space behind the flat image you see every day.
- Layers from averaged bands. The display can't show every band, so neighboring bands are averaged into 40 evenly spaced layers, about 7 source bands each.
- Color that shows the limit. Signal heat shows the true strength of the response. Wavelength false color shows visible wavelengths in the colors we recognize, which makes clear where human color vision stops: everything beyond violet and red stays dark. Warm white works as a neutral fill.
- Four modes, in the order people make sense of it. Volume shows the full signature. Inspect layer isolates one wavelength, where the image starts to appear. Inspect location shows the depth of the signal at a single point. Combine RGB brings it together.
- Isolate a response. Choose an absorption feature, such as the dip near 2,100 nm, and raise the minimum response. Locations without it fade back while the rest of the capture stays in view, and a count shows how many remain.
- Help on demand. Much of the tool is technical but learnable. Instead of caveats beside every control, a "?" next to each part explains it in plain language when someone wants it.
Watching someone use it turned up a problem here. Inspect layer opened on the first layer, at the blue end of the range, where only about a quarter of the lights come on, so the mode looked empty. It now opens on the layer that lights the most of the scene.

What I noticed
The answer to the first question was yes. At 64 by 64 lights, the coastline is still recognizable: the person I watched picked it out without being told what it was. It resolves most clearly in the moment the three bands come together. That transition, from blob to image, is the part of the tool that does the most work.
The first person I showed it to said it looked like Interstellar.
Next
- Run it on my own captures. Load scenes from Hyperspectra instead of airborne data.
- Watch a stranger use it. See where someone gets stuck without me there to explain.
- Build the display. Move from the browser to the physical light volume it was designed for.