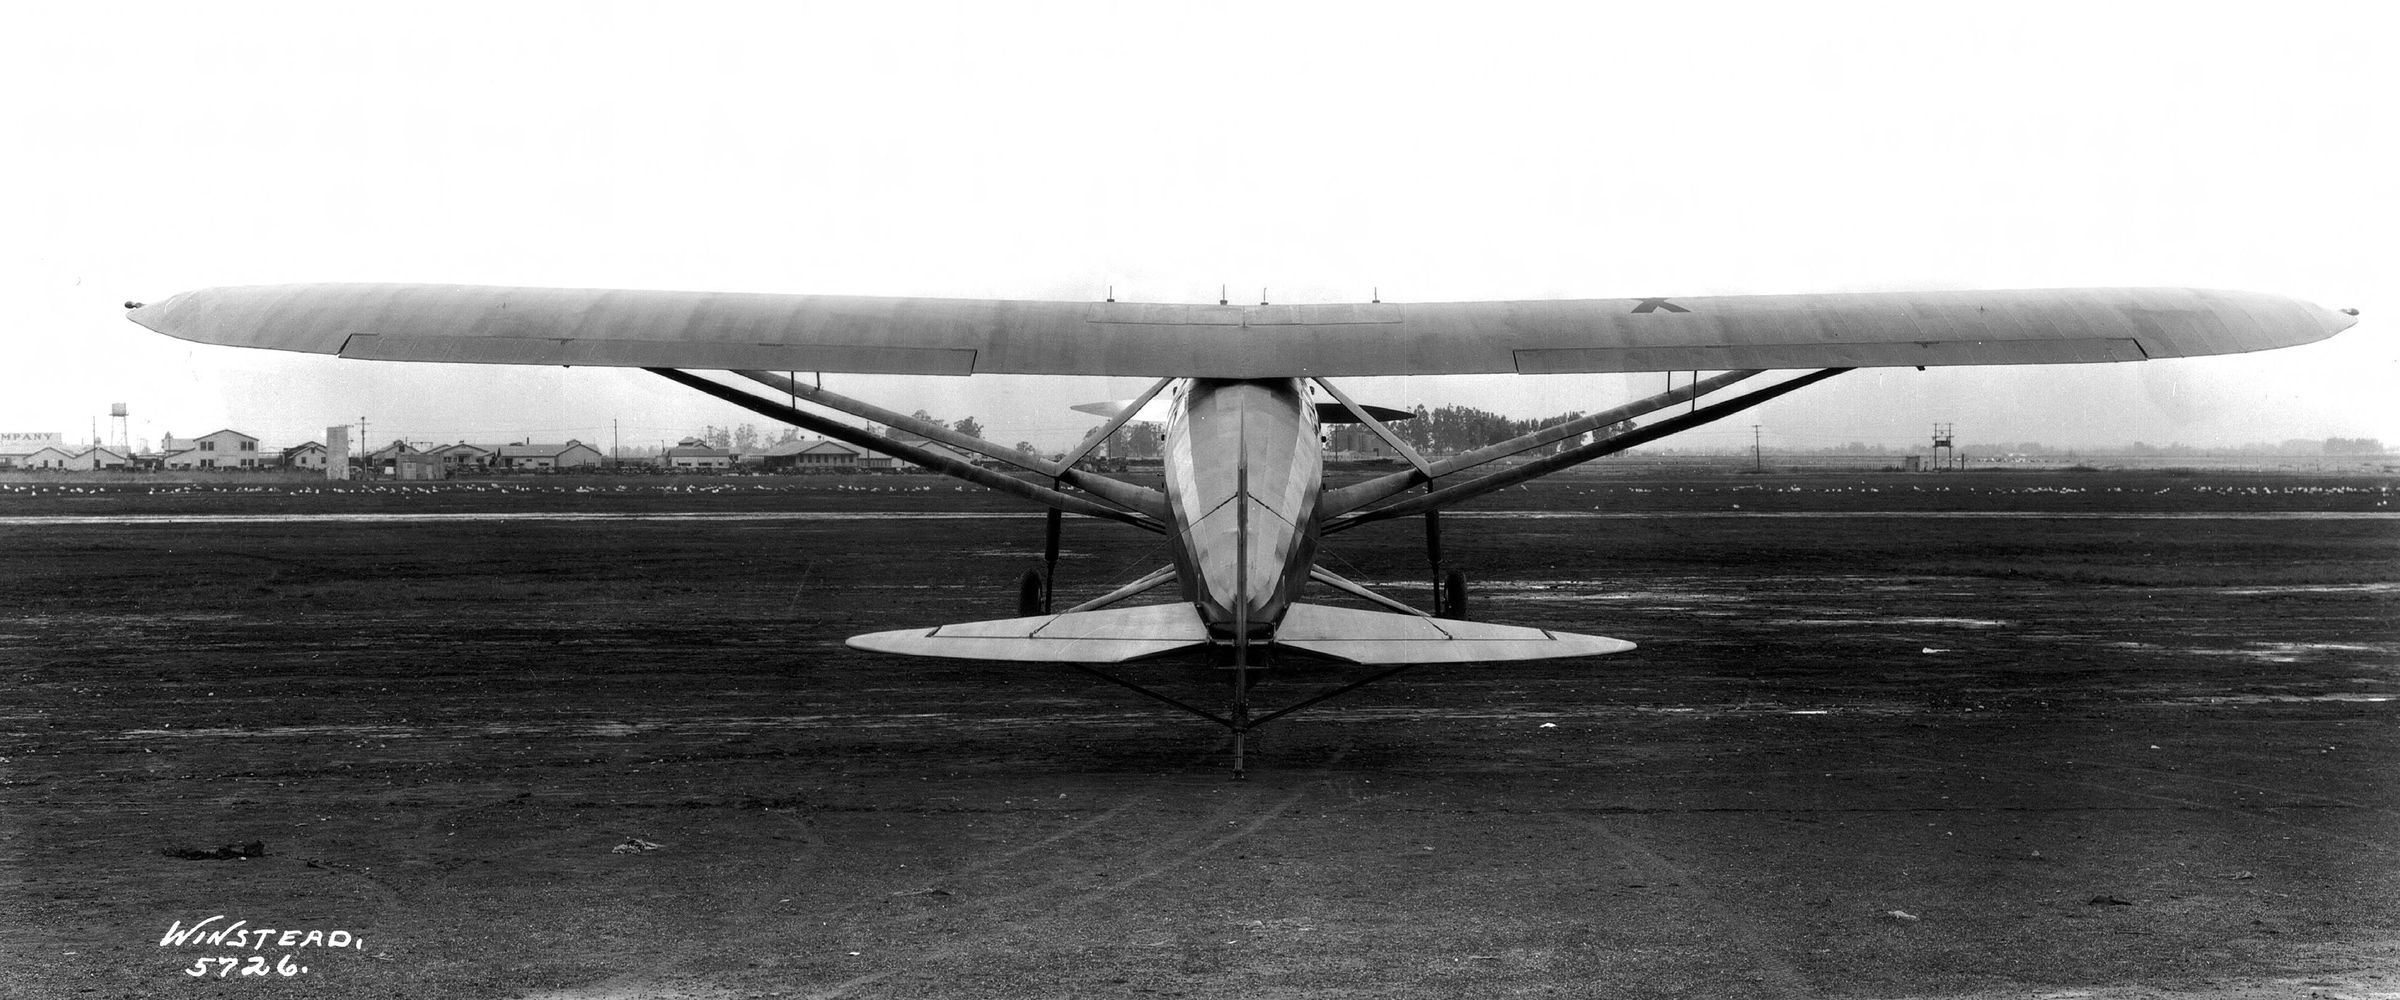
Long Beach Airport, about 1928. Photo: Winstead / Long Beach Public Library
Southern California Historic Aerial Viewer
A map for seeing how Southern California came to be, with 1920s aerial photography laid over the region as it is today.
- Context
- Personal project, 2026
- Role
- Concept, historical research, interaction design, GIS, build
- Data
- Historic aerial photographs from the UCSB Library Geospatial Collection; present-day imagery from Esri
- Tools
- Leaflet in the browser, built with AI coding agents. AI is my general assistant for research and prototyping; I direct the work and test the result.
- Try it
- christophernagel.com/history
Why
My background is in theater design, where you learn to take a production apart by working backward from the effect. What pieces, cues, and changes over time made it work? I wanted to look at Los Angeles the same way and understand how the city I know came to be.
I built it for myself first. I also had policy researchers in mind: people studying how transit shaped development, or why neighborhoods ended up with such different outcomes.
Starting point
UCSB's FrameFinder holds the historic aerial archive, along with the flight and camera details needed to correct the images. But each photo is a point on a generic map. You click it, load one image, and compare frames one at a time. I wanted to see the connections directly, across a whole area at once.

How it grew
- Places. Once the photos were on the map, I wanted to find places I knew. Then I added lesser-known places that local historical groups keep records on. I researched each one, drafted descriptions with AI, then rewrote them and checked them against sources.
- Comparison. I added a draggable divider between the old photos and today's satellite view. A fade takes the image away on its own schedule. A divider lets you flip back and forth at your own pace and keep the earlier image in mind while you look at the new one.
- Time. Adding more years created the central design problem. Coverage is dense for 1926–28 and patchy for other decades, and places appear, change, and disappear. Each place now has a state for each year. The year buttons on a place's card also move the map to that year, so the description and the photography change together.
- A link for every view. The year, zoom, comparison, and selected place all live in the address, so any view can be shared exactly as you see it.


What I saw
The first person I watched use it lit up at the comparison: "Oh, this is it. Now it makes sense." Search and directions interested them too, but the comparison got the biggest reaction.
It also had the least visible way in: a small icon with no label. After that session I added a "Compare" label to the button. On phones the toolbar has no room for the word, so there it is still the icon.
Alignment
The hardest problem was alignment. Dragging photo corners into place left small errors I couldn’t fix by hand, and they compounded. Each photo had been bent to agree with its neighbors, so whole layers sat 10 to 40 meters off the streets they showed, and two 1927 layers over Beverly Hills disagreed by as much as 95 meters. So I borrowed methods from my hyperspectral camera project. Instead of warping each photo to fit, I modeled the camera that took it: its position, height, heading and tilt, focal length and lens distortion. Thousands of points shared between overlapping prints tied each flight together so it could be solved as one piece. Every print was held rigid, because letting them stretch let photos drift 65 to 130 meters. Each photo was then projected onto a USGS elevation model so hillsides land where they belong.

To pin the flights to the ground, I matched them against today’s streets. Each photo was rendered from its current camera and compared, patch by patch, with OpenStreetMap street outlines and satellite imagery. Every match became a control point, weighted by how far it could be trusted. The highest weight went where the street map and the satellite agreed on a major road or a rail line, since those section-line roads mostly existed in the 1920s. Ordinary streets counted for less, then field lines and canals, then a lone satellite match, and anything near water least of all. After each solve I measured again from the improved position, because matches taken from a bad start lock onto the wrong street. On the 1938 flight, 93 percent of the re-measured points agreed with the first solve within 10 meters.

Streets only work where streets survived. On 1920s farmland, dunes and marsh, street matches were noise, and so were they at Irvine, where today’s grid has nothing to do with the 1931 ranch roads. One 1946 print read 330 meters off by its street matches, yet it sat within a meter of the 1938 photos. In those places I anchored new photos to blocks I already trusted, and to fixed landmarks like the ends of piers. The piers caught an error nothing else would. The first placement of a 25-kilometer strip of the 1927 coast, bent by its lens, sat 350 to 470 meters off at Huntington Beach, Newport and Balboa, yet it looked right along the shoreline. Each run was scored on check points left out of the fit, usually 2 to 4 meters off. Then I checked it by eye: I drew today’s street outlines over the photos and laid overlapping layers in red and cyan, where any offset shows as colored fringes.


Exposure was its own problem. Every print is brighter where the sun’s hot spot falls and darker toward the corners. On the 1931 flight the centers ran about 1.2 times the average and the corners 0.4 to 0.7. I measured that falloff from the 16-bit scans, so the bright centers wouldn’t clip to white. On the 1947 flight each print got its own tilt, because the sunny side flips with the flight direction. Brightness was matched on land only, since sun glitter on the ocean changes from photo to photo. On the 1947 layer, that cut the typical brightness step at photo joins from 13 grey levels to about 5.
Next
- Show coverage. Make clear which years cover which areas, so people know what they're looking at.